What Is Expected Goals (xG) In Football? Simple Guide For Beginners
Learn what Expected Goals (xG) means in football, how it’s calculated, and why it’s changing the way we understand team performance.
Expected Goals (xG) is a football statistic that measures the quality of a scoring chance. It predicts how likely a shot will result in a goal based on factors like shot distance, angle, and type. Here's a simple guide to understanding xG in football.
Alright, so you’ve probably heard commentators throw around the term “xG” like it’s common knowledge. And if you’ve ever sat there wondering if you missed a class on football math, don’t worry—you’re not the only one. xG sounds technical, but it’s really just a clever way to say, “Not all shots are created equal.”
Let’s break it down, nice and easy.
What Exactly Is Expected Goals?
xG stands for "Expected Goals." Here’s the simplest way to think about it: xG measures how likely a particular shot will result in a goal, based on thousands of similar shots taken in past matches
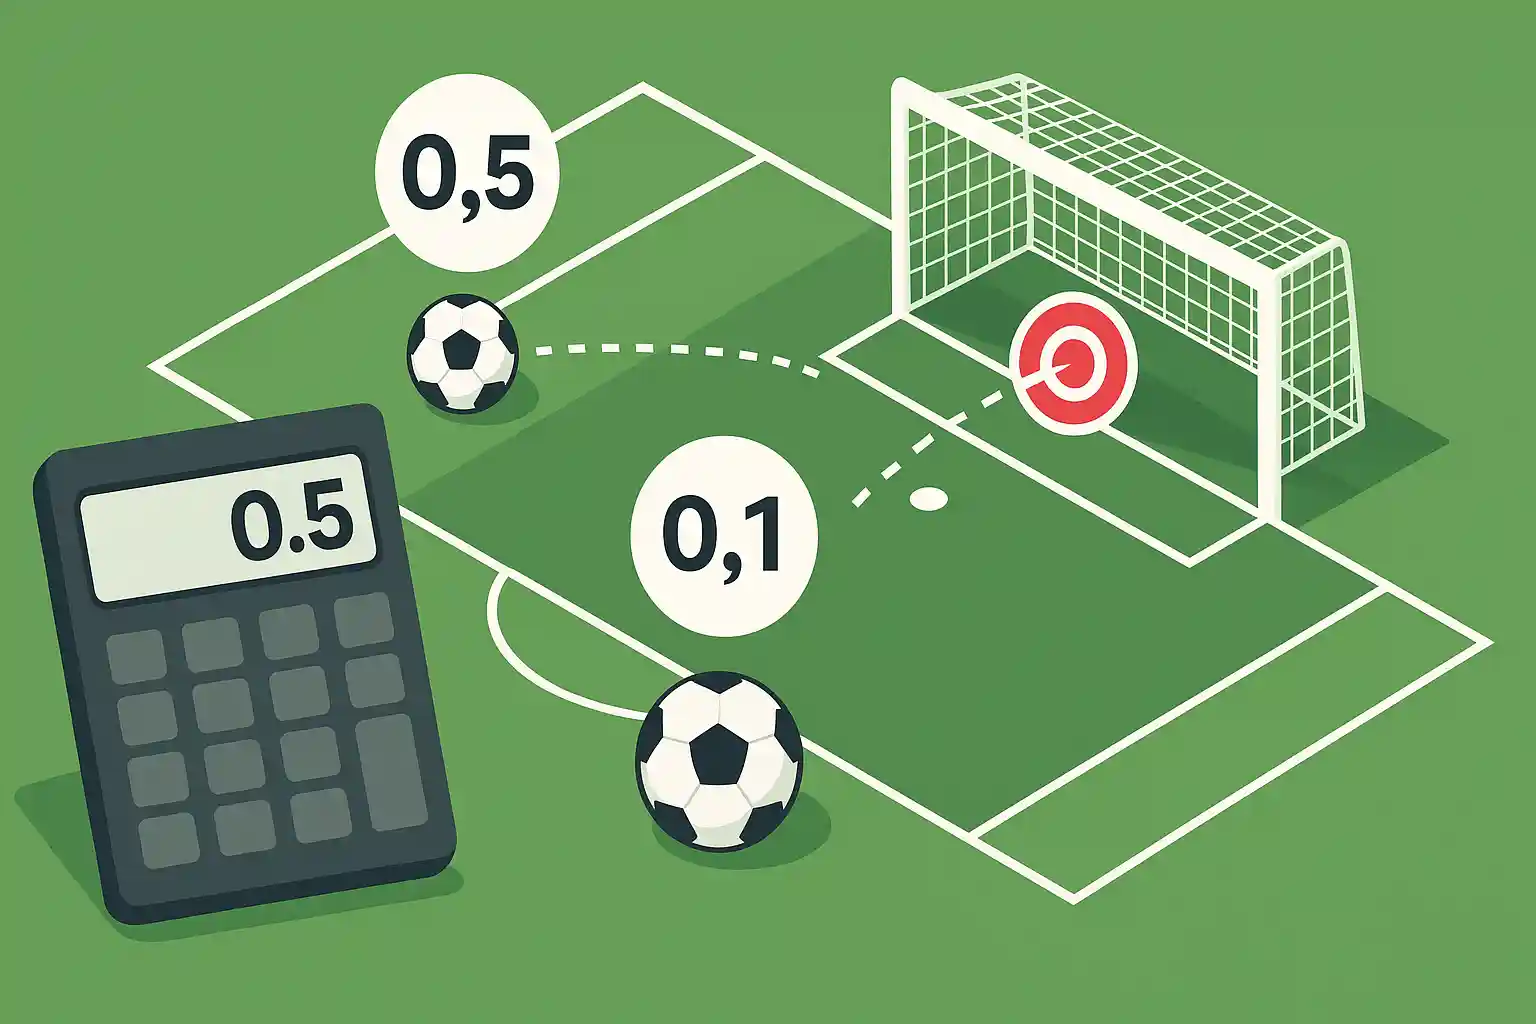
For example:
- A penalty kick has an xG of *0.76**. That means penalties get scored about 76% of the time.
- A wild shot from 30 yards out, with defenders swarming, might have an xG of *0.03**—pretty much a Hail Mary.
- A tap-in from five yards? That’s probably around 0.8 to 0.9 xG—meaning it has an 80-90% chance of being scored.
So xG doesn’t tell you whether a goal was scored—it tells you how likely it was to be scored based on past data of similar chances.
Simple, right? Well, kind of.
Why Fans Should Care About xG
Here’s the thing: football can be cruel. You can dominate a match, create 10 glorious chances, hit the post three times, and still lose 1-0 because the other team scored from their only shot.
That’s why xG is such a hit with analysts and coaches.
xG helps you understand performance beyond the scoreboard.
Imagine a match where Team A loses 1-0 but has an xG of 2.5, while Team B’s xG is 0.4. Statistically speaking, Team A created way better chances and were unlucky not to score.
xG gives fans a way to say, “See? We actually played well!” without sounding like they’re making excuses.
"But xG Doesn't Win Matches, Goals Do!" — True, But...
You’re right. At the end of the day (oh wait, scratch that cliché), matches are decided by goals, not probabilities. No trophy has ever been lifted because of a team’s superior xG.
But here’s a twist: over the long run, teams that consistently generate high xG tend to perform better. It’s a numbers game. Think of it like flipping a weighted coin—keep flipping, and eventually, the odds catch up.
So when a pundit says, “Their xG numbers look solid,” it’s a polite way of saying, “If they keep playing like this, the goals will come.”
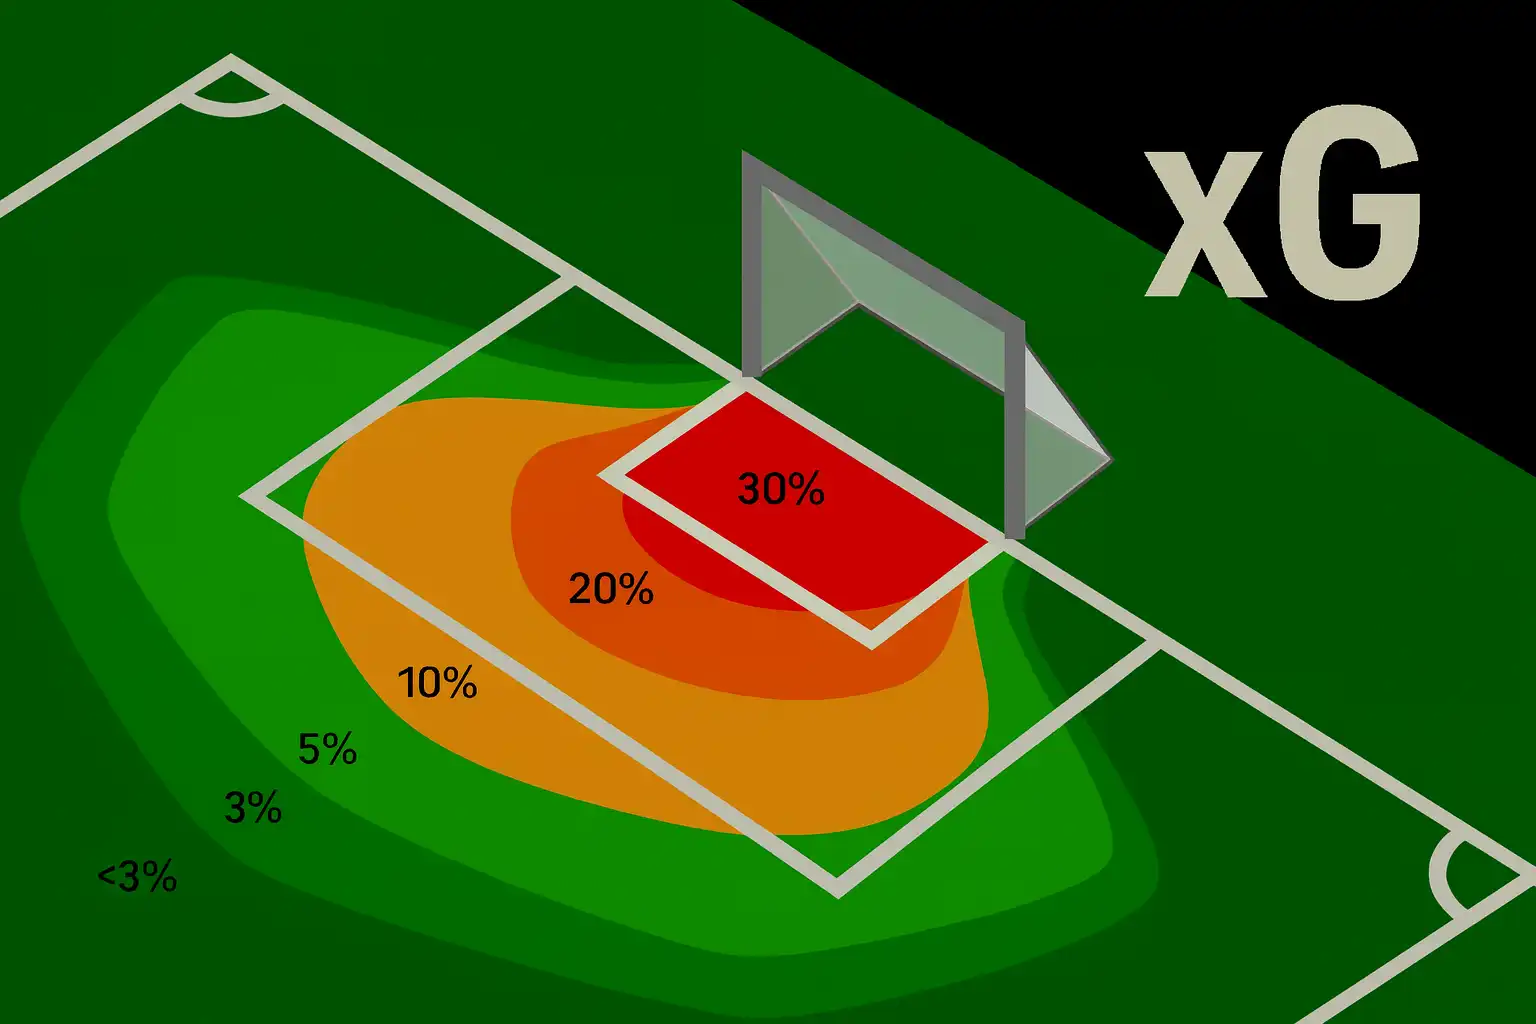
How Is xG Calculated?
Alright, brace yourself, but I promise not to bore you to death.
Expected Goals models consider a bunch of factors for every shot, like:
- Distance from goal: Closer to goal = higher xG. A penalty spot shot? Around 0.76 xG as I already mentioned.
- Angle of the shot: Central shots are golden; sharp-angled ones are harder.
- Body Part Used: Headers usually have lower xG than shots with the feet.
- Assist Type: Was it a through-ball, a cross, a rebound? A pass that breaks the defense open boosts xG.
Some models also consider:
- Was it a one-on-one with the keeper?
- Were defenders blocking the path?
- If it was a first-time shot or not.
These factors get crunched using thousands of historical shots. The result? A decimal number between 0 and 1 representing the chance of scoring.
Think of it as a smart friend who’s watched a million matches and says, “Eh, that shot? 12% chance, tops.”
But you don’t need to crunch the numbers yourself—tools like Opta, StatsBomb and even Fantasy Premier League do the heavy lifting. You just enjoy the match.
Common Misunderstandings About xG
Now, xG isn’t magic. People often misunderstand or misuse it. Let’s tackle a few myths head-on.
High xG = Guaranteed Goal
Nope. xG is about probabilities, not certainties. A chance with 0.8 xG still misses 20% of the time. Players are human (even Messi fluffs a sitter now and then).
xG predicts the final score.
Nope. Expected Goals describes the quality of chances, not the final result. It’s descriptive, not predictive.
xG is About Shot Power
Not really. Whether it’s a toe-poke or a thunderbolt, xG cares more about where you are on the pitch, how the chance was created, and other factors. A soft tap-in from two yards will have a higher xG than a 30-yard rocket.
xG Replaces Watching the Game
Definitely not. xG is a tool to enhance your understanding, not replace the eye test. It explains the "why" behind missed chances or surprising results, but it’s no substitute for watching a cheeky nutmeg or a last-ditch tackle.
Why Are Pundits So Obsessed With xG?
Honestly? Because xG offers something football has lacked for years—an objective way to measure performance, not just outcomes.
Remember when "parking the bus" used to be a compliment? Well, xG exposes how teams rely on low-percentage tactics and sometimes get away with it. It also highlights teams that are "underperforming"—like that striker who keeps hitting the post but is, statistically, making great runs.

A Quick Reality Check — xG Isn’t the Full Picture
Here’s where we need to pump the brakes a little.
xG doesn’t measure player skill directly. A world-class striker might consistently outperform their xG because they’re simply better finishers. Think of players like Erling Haaland—he breaks xG models because his positioning and reactions are off the charts.
It also doesn’t account for post-shot factors like incredible saves, hitting the woodwork, or, you know, moments of pure magic.
So, while xG tells you how good a chance was, it can’t predict whether Lionel Messi will do something... well, Messi-like.
Final Whistle
Expected Goals isn’t just stat geekery. It’s a way of understanding football that goes beyond goals and assists. It tells you which team is playing better, who’s creating danger, and who might be living on borrowed luck.
And hey, next time you’re in the pub and someone says, “We battered them but still lost!”, you can smile and reply, “Yeah, the xG backs that up.”
It’s a small win, but we’ll take it.
Want more no-nonsense football explainers? Stick around—we’ll make analytics feel like matchday banter.
FAQs About Expected Goals (xG)
What is a good xG for a striker?
For top strikers in Europe’s big leagues, an average of 0.4 to 0.6 xG per shot is considered excellent. Over a season, if a player consistently racks up high xG and converts those chances, you’re looking at an elite finisher.
Do all leagues track xG?
Most major leagues, including the Premier League, La Liga, Bundesliga, Serie A, and Ligue 1, have detailed xG data. Lower divisions and less-covered leagues may not have public xG stats, but it’s becoming more widespread.
Should You Care About xG If You’re Just a Casual Fan?
Only if you want to. Football’s beauty is that you can enjoy it without knowing a single stat. But if you’ve ever felt the itch to understand why your team feels “unlucky” week after week, xG is your new best mate.
How does xG help in analyzing team performance?
xG provides insight into the quality of chances a team creates and concedes. It helps distinguish whether a result was due to efficient finishing, poor defending, or simply variance in outcomes.
Can xG predict future match results?
xG is not designed to predict specific match outcomes. However, over the long term, teams that consistently generate higher xG than they concede are more likely to achieve better results. It reflects performance trends rather than exact predictions.